C# Memory Leaks
• c-sharp
For the past three or four work days I have been trying to find a memory leak in a Windows Service we created that is used to synchronize data between two systems on a nightly basis. I had just added a single method to it for a new job and the memory usage was climbing until it hit the 2GB process limit.
At first I thought it might be something going wrong in my foreach loop. That was the only thing I added running enough to create that kind of usage. I was looping over 200,000 items for the initial sync so all it wouldn’t be that hard if I had a object keeping track of everything I synced. But I didn’t have any of that. I went through my loop several times. Then I started wondering about the method generating the API calls to the other system. If something was going wrong there it would easily explain the memory usage. I had to make up to 3 API calls for each loop iteration.
At first I thought it might be because the class for making the API calls was static and I saw an article that said static objects aren’t garbage collected, so I started digging through there but couldn’t find anything. Then I decided I needed to confirm a memory leak. I pulled out Performance Monitor and set it to track the Private Bytes for my process. Sure enough as soon as I triggered the sync the memory usage steadily took off. Once I had whittled down the objects I had to work on so I wouldn’t run out of process memory I saw that when it was done it wouldn’t release the memory. Now I really had to find the problem, restarting the service nightly wouldn’t be viable.
I found a tool called DebugDiag and that proved invaluable. I was able to create a dump of the process and then generate a report. That report had a great warning at the top that lead me to an article explaining exactly what was going on.
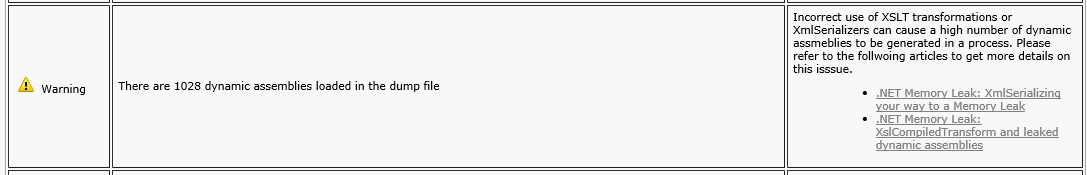
As it turns out XmlSerializer will generate a new temporary assembly when the constructor is called. In my case, up to 6 calls for each loop iteration covers the memory issue I was having. XmlSerializer was being used for tracing and was surrounded by preprocessor directives, so if I had compiled for production instead of debugging the issue would never have shown itself. One of my coworkers had that code there because he needed it for debugging some issues, so I commented it out and added a warning about the memory issue.
Now the service runs with a maximum of 56MB of memory as opposed to shooting up to 2GB. The problem may not have shown up in production, but at least we know about XmlSerializer for the future. If you can help it instantiate it once and use that over and over.